Skip to content


To analyse a football match before betting, work through five things in order: the fixture and its market rules, how both teams have actually been performing, confirmed team news, how their styles match up, and finally the odds. The aim is not to pick the stronger team. It is to answer two separate questions: what does the evidence support, and does the price justify the risk?
Most fans can find plenty of numbers. The hard part is knowing which ones matter and what to do when they point in different directions. This guide gives you a repeatable process, a worked example with the maths shown, and a checklist you can reuse every matchday. If you mainly follow the English top flight, our Premier League football betting page covers the competition itself.
Key takeaways
- Results need context. A 3-0 win over a side in the relegation zone tells you less than a 1-1 draw away at a title contender.
- Probability and price are different questions. A team can be likely to win and still be poor value at the odds on offer.
- Skipping a match is a valid result of good analysis. If the evidence is thin or contradictory, not betting is often the most disciplined decision.
What Is Football Match Analysis?
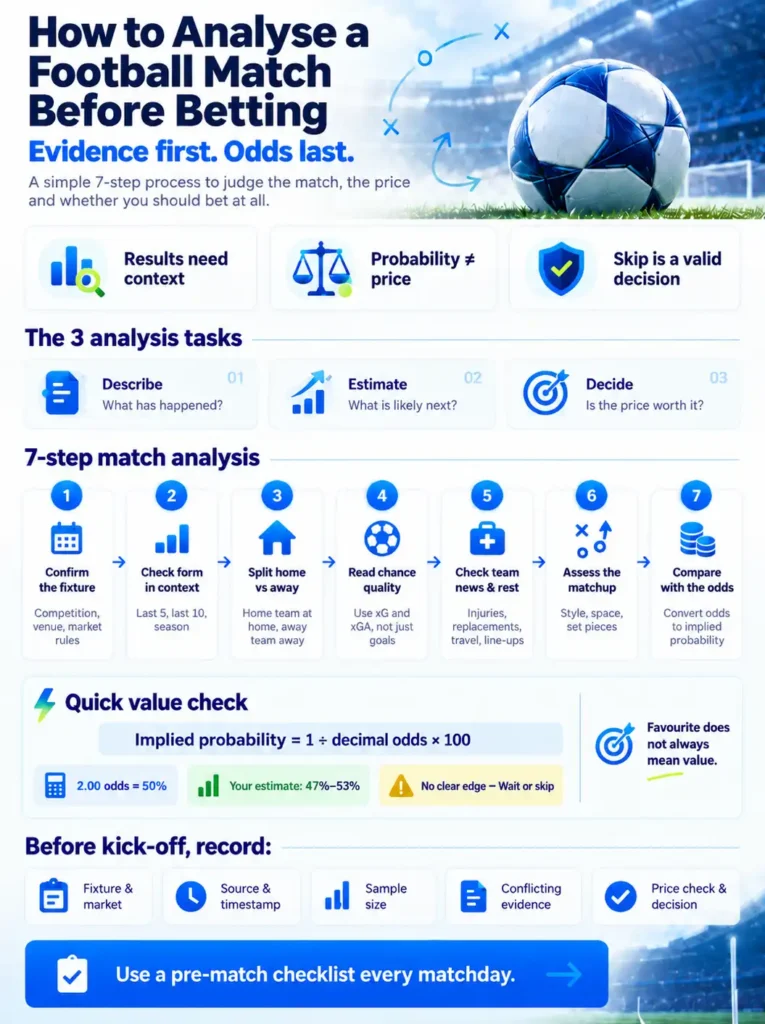
Football match analysis is the process of turning information about two teams into a reasoned view of what might happen in their next game. It goes well beyond checking who won last weekend. In a betting context, it covers three separate tasks, and mixing them up is where most mistakes start.
| Task | The question it answers | Example |
| Describe | What has happened so far? | “They have won four of their last five, but created fewer chances than their opponents in three of those games.” |
| Estimate | What is likely to happen next? | “I think the home side wins this roughly half the time.” |
| Decide | Is the price worth taking? | “At odds of 2.00, I need them to win more than 50% of the time to break even.” |
The first task uses facts. The second uses judgement built on those facts. The third compares your judgement with the market. Good analysis keeps all three visible, so you always know which parts of your view are evidence and which are assumptions.
How to Analyse a Football Match Before Betting
The seven steps below run in a deliberate order. You build a view of the match first and look at the odds last, so the price does not quietly shape what you think the evidence says.
1. Confirm the Fixture and the Market Rules
Before looking at a single statistic, be clear on what you are analysing. Note the competition, which team is at home, and whether the venue is neutral. A league match and a cup tie can call for very different approaches from the same two teams.
Then check what the market actually covers. A match result (1X2) market usually settles on the score after normal time, including stoppage time. A “to qualify” market in a knockout tie also counts extra time and penalties. A team can draw 1-1 over 90 minutes and still qualify, so the same opinion can win one bet and lose another. Always read the specific market rules rather than assuming.
2. Compare Recent Form With the Bigger Picture
Recent form is useful, but five matches is a small window. Look at three views side by side: the last five matches, the last ten, and the season so far. None of these is a magic sample size. Each one simply trades recency against reliability.
| View | Strength | Weakness |
| Last 5 matches | Reflects current fitness, tactics and confidence | Easily distorted by one red card or a soft run of fixtures |
| Last 10 matches | Smooths out one-off results | May include a period under a different manager or system |
| Season to date | Largest evidence base | Can hide a genuine recent change |
For each result, note who the opponent was, where it was played, and anything unusual such as an early sending-off or a heavily rotated line-up. Four wins against the bottom four is not the same as four wins against the top half. If a manager has changed, give more weight to matches under the current one.
3. Separate Home and Away Performance
Overall records can hide a big difference between how a team plays at home and on the road. The most relevant comparison is usually the home team’s home performances against the away team’s away performances.
Always show how many matches sit behind each figure. “Concedes 1.8 goals per game away” sounds significant, but if it comes from five away matches, one 4-0 defeat can account for much of it. A small sample is not useless. It just deserves less confidence.
4. Read Chance Quality, Not Just Goals
Goals decide matches, but they are rare and noisy. Chance quality tells you more about how a team is really playing. This is where expected goals come in. If you are new to the metric, start with what xG means in football.
In short, xG estimates how likely each shot was to be scored, based on factors such as distance, angle and the type of chance. A team’s xG is the total for its shots. xGA (expected goals against) does the same for the chances it allows. Non-penalty xG removes penalties, which are high-value chances that depend heavily on referee decisions.
The useful question is what to do when results and chance quality disagree. Here is an illustrative example:
| Team (last 5 matches, illustrative) | Results | Goals for / against | xG for / against |
| Team A | 4 wins, 1 draw | 9 / 3 | 6.1 / 6.4 |
| Team B | 1 win, 2 draws, 2 losses | 5 / 7 | 7.8 / 4.9 |
Team A’s results look far better, yet it has allowed slightly more chance quality than it created. Team B has been the better side by xG but has not converted. This does not mean Team A is “due” a defeat. It means Team A’s results may be less repeatable than its form table suggests, and the gap deserves a closer look.
Two cautions apply. First, historical xG describes chances already created. Turning it into a forecast for a future match takes further modelling and context. Second, different providers build different xG models and can value the same chance differently, as Hudl Statsbomb explains. Keep every comparison within one provider’s numbers.
Shots need the same context. Twenty shots from outside the box can be worth less than five from close range. Once you have the basics, our guide on how to read football match statistics shows how to combine these numbers without double counting.
5. Check Team News, Replacements and Rest
Not every absence matters equally. For each missing player, ask three questions:
- Is the absence confirmed? An official club statement or the Premier League’s injury updates carry more weight than a social media rumour.
- What is the player’s role? A first-choice centre-back in a team that defends deep matters more than a rotation winger.
- Who replaces them, and does it change the system? A like-for-like swap is different from a switch from a back four to a back five.
Also check rest and travel. A side coming off a midweek European away trip may rotate or tire late. Then look again when official line-ups are released, usually around an hour before kick-off. For Singapore readers, that can mean late at night: a 3pm UK kick-off is 10pm in Singapore during British Summer Time and 11pm in winter. An 8pm UK kick-off falls after midnight here, so record the Singapore date as well as the time.
6. Assess How the Teams' Styles Match Up
Two teams with similar numbers can produce very different matches depending on how their styles interact. Look for where one side is likely to create chances and where it may leave gaps.
A simple example: a home team that pushes its full-backs high to dominate possession can leave space behind them. If the away side is built to counterattack quickly down the flanks, that space becomes the most important area of the pitch. Set pieces work the same way. A team that concedes many headed chances facing a side with tall centre-backs is a real matchup issue, not just a statistic.
Treat head-to-head records as supporting context, not a rule. A result from three seasons ago often involved different players, different managers and a different tactical plan.
7. Compare Your Assessment With the Odds
Only now look at the price. Convert the decimal odds into the probability they imply:
Odds of 2.00 imply 50%. Odds of 4.00 imply 25%. If you are unfamiliar with formats or margins, read how football betting odds work first.
Then ask three honest questions. What probability does your assessment support? Which parts of it are facts, and which are assumptions? Could the apparent advantage disappear once you allow for the uncertainty in your own estimate? The worked example below shows why the last question matters most.
The same process applies to other markets, but the evidence of your weight changes. Total goals depend more on both teams’ attacking and defensive chance quality than on who wins. See over/under betting explained for that market.
Worked Example: A Favourite Is Not Automatically a Good Bet

This example uses a fictional fixture and illustrative odds to show how the steps fit together. It is a teaching example, not a prediction for any real match.
Fixture: Riverside FC (home) vs Harbour Town, league match, normal venue.
Market: match result (1X2), settled after 90 minutes plus stoppage time.
What the evidence says
| Step | Finding | What it suggests |
| Form | Riverside: 4 wins in last 5, 6 in last 10. Harbour Town: 2 wins in last 5. | Riverside in better recent form |
| Home and away | Riverside unbeaten in 6 home games. Harbour Town have lost 3 of 6 away. | Supports Riverside, but samples are small |
| Chance quality | Riverside’s xG difference over the last 5 is close to level despite the wins. | Results may be running ahead of performance |
| Team news | Riverside’s first-choice striker is listed as doubtful. Not yet confirmed. | Unresolved. Recheck at line-up release |
| Matchup | Harbour Town counterattack well; Riverside play high full-backs. | A genuine route to goal for the away side |
The picture is mixed. Riverside are rightly favourites, but two pieces of evidence (chance quality and the matchup) push against the headline form, and one key fact is still unknown.
What the odds imply
| Outcome | Decimal odds | Raw implied probability | Margin removed (proportional) |
| Riverside win | 2.00 | 50.00% | 48.28% |
| Draw | 3.50 | 28.57% | 27.59% |
| Harbour Town win | 4.00 | 25.00% | 24.14% |
| Total | 103.57% | 100% |
The raw probabilities add up to 103.57%, about 3.57 percentage points over 100%. That excess is the market’s overround, sometimes called the bookmaker margin. It is built into the prices, so the odds on every outcome are slightly shorter than a margin-free price would be. It is not a forecast of the bookmaker’s actual profit on this match.
The last column spreads the margin out proportionally (each raw figure divided by 1.0357). This is one simple method among several, but it gives a fairer read of what the market thinks.
Comparing the assessment with the price
Suppose your assessment, after weighing everything above, puts Riverside’s chance somewhere between 47% and 53%. This range is illustrative uncertainty for teaching purposes, not a statistically calculated confidence interval.
At odds of 2.00, the break-even point is exactly 50%. A $10 stake returns $20 in total if Riverside wins, including your original $10. Here is what that stake is worth on average at each end of your range:
| If Riverside’s true chance is | Average return on $10 | Average profit or loss |
| 47% | $9.40 | -$0.60 |
| 50% | $10.00 | $0.00 |
| 53% | $10.60 | +$0.60 |
Your own range sits on both sides of the break-even line. You cannot say the bet has an advantage, because your uncertainty is larger than any edge you might have.
The decision
The reasoned outcome here is not to bet at this price, at least not yet. If the striker is confirmed fit, your estimate might move up. If he is ruled out, it might move down and make the draw or the away side worth a second look. Either way, the next step is to wait for confirmed line-ups rather than act on incomplete information.
Three lessons carry over to any match. The favourite can still lose. A quoted price is not a verified probability. And your uncertainty can easily be larger than the advantage you think you have found.
Next step: Use the pre-match analysis checklist to record your own assessment before kick-off.
Common Football Analysis Mistakes

Overreacting to one result. A 5-0 thrashing is memorable, but it is one match. Check whether the performance behind it (chances created and allowed) was as one-sided as the score, and whether something unusual, like an early red card, shaped it.
Relying on old head-to-head records. “They haven’t lost to this opponent in eight meetings” sounds persuasive. If most of those meetings involved different squads and managers, it tells you very little about this weekend.
Counting related statistics as separate proof. Possession, shots, corners and touches in the box often rise together because they all reflect the same territorial dominance. Listing all four as reasons to back a team is really one argument repeated four times.
Treating rumours as confirmed news. A report that a key player “could miss out” is not the same as an official absence. Mark it as unresolved and check again when line-ups are announced.
Assuming a team is “due”. A side that has scored fewer goals than its xG suggests is not owed goals in the next match. As Opta Analyst notes, past overperformance or underperformance does not have to balance out. Believing it must is the gambler’s fallacy. What the gap does tell you is that results may move closer to underlying performance over time, not that they will correct on a schedule.
Your Pre-Match Analysis Checklist
Use this worksheet for each match you analyse. Fill it in before kick-off and keep it. Later, you can review whether your reasoning was sound, separately from whether a bet won or lost. A good decision can lose, and a poor one can win.
| Field | What to record | Example entry |
| Fixture and market | Competition, venue, market and how it settles | League match, home venue, 1X2 after 90 minutes |
| Source | Where each key fact came from | Club statement; one xG provider for all chance data |
| Information timestamp | When you checked, in Singapore time | Sat 17 Oct, 9:15pm SGT |
| Sample size | How many matches sit behind each figure | Home form: 6 matches. Away form: 6 matches |
| Main finding | Your one-line read of the evidence | Home side stronger, but results ahead of chance quality |
| Conflicting evidence | What points the other way | Away side’s counterattack suits this matchup |
| Unresolved questions | What you still do not know | Striker’s fitness not confirmed |
| Price check | Implied probability vs your estimated range | Odds imply 50%; my range is 47% to 53% |
| Decision | Bet, wait or skip, and why | Wait for line-ups; skip if nothing changes |
Before you finish, answer two final questions:
What would change my assessment? Is the evidence strong enough to make a decision, or should I skip this match?
The Bottom Line
Good football match analysis is less about finding a winner and more about understanding what the evidence supports, what remains uncertain, and whether the price makes the risk worthwhile. Work through the fixture, performance, team news, matchup and odds in that order. Write your reasoning down before kick-off. And treat “skip this one” as a perfectly good conclusion.
Review the evidence, check what remains uncertain, and decide whether the match is worth considering at all.
Play responsibly. Betting should only ever be done with money you can afford to lose. Set a budget before you start, never chase losses, and take a break if betting stops being enjoyable.
Frequently Asked Questions
How many previous matches should I analyse?
There is no perfect number. Compare the last five, the last ten and the full season, then see what has changed.
Is xG more useful than recent results?
Use both. Results show what happened, while xG shows how well a team is really playing.
How much weight should I give head-to-head records?
Very little. Only recent meetings with similar squads and the same managers are worth considering.
Should I wait for confirmed line-ups before deciding?
Yes, if a key player is doubtful. Line-ups usually come out about an hour before kick-off.
Why is the favourite not always a good-value bet?
Because value depends on the price. A team with a 60% chance is a poor bet at odds that imply 65%.
Can football match analysis guarantee a winning bet?
No. Analysis improves your decisions, but football is unpredictable and no result is guaranteed.