Skip to content

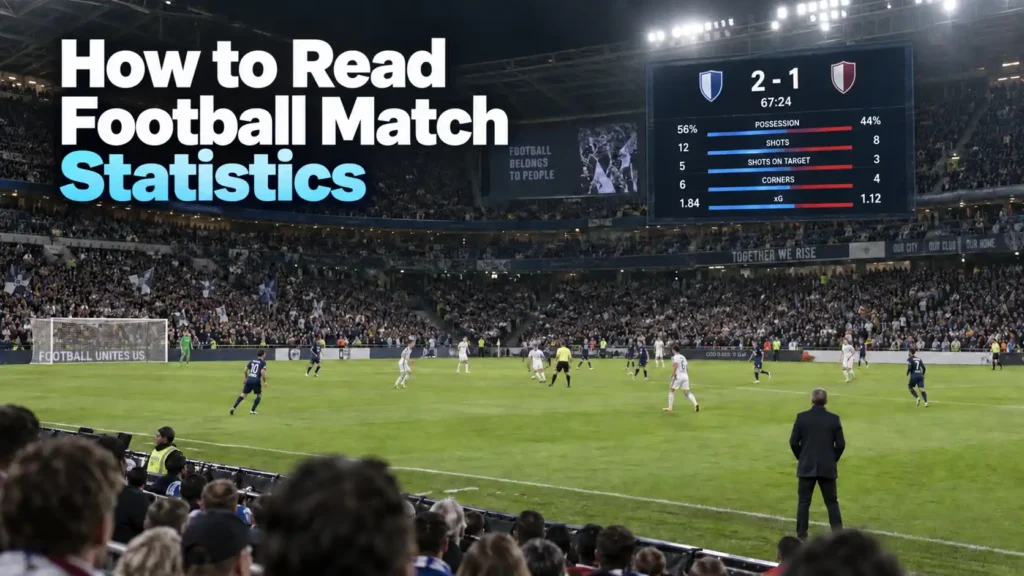
A team finishes with 65% possession and 15 shots, but loses 1-0. Did it play better?
Not necessarily. Football match statistics describe what happened on the pitch, but no single number tells you who played well. Possession shows who had the ball. Shots show how often a team tried to score. Expected goals (xG) suggests how good those chances were. You only get a fair picture when you read these numbers together, in the right order, alongside the score and the key moments of the match.
This guide gives you a simple five-step method for reading any match stats screen, explains what each common statistic measures (and what it can’t tell you), and walks through a complete match example. If you’re new to football numbers, it’s a good starting point before exploring our other Premier League football guides.
Key takeaway: Start with the score and match events, then compare shots, then shot quality (xG), and only then possession and passing. One statistic on its own can mislead. Several reads together tell you the story of the match.
What Are Football Match Statistics?
Football match statistics are recorded counts and measurements of what each team did during a match, such as shots, passes, fouls and time on the ball. Most stats screens group them into five families.
| Category | Common statistics | What it tells you |
| Attacking | Shots, shots on target, expected goals (xG) | How often a team tried to score, and how good those chances were |
| Possession | Ball possession %, passes, passing accuracy | How much a team controlled the ball, and how securely |
| Set pieces | Corners, free kicks | How often a team won dead-ball chances near goal |
| Defensive | Tackles, interceptions, clearances, saves | How a team dealt with the opponent’s attacks |
| Discipline | Fouls, yellow cards, red cards, offsides | How often a team broke the rules, and with what consequence |
It also helps to know that these numbers come in three different types:
- Raw counts such as shots, corners and fouls are simple tallies of events.
- Percentages such as possession and passing accuracy are ratios. 90% passing accuracy from 200 passes is a very different performance from 90% across 600.
- Model-based statistics such as xG are estimates produced by a statistical model trained on large numbers of past shots. They aren’t counts of something that happened, so two data providers can show slightly different xG for the same match.
At the top level, data is logged event by event by specialist providers. Opta, for example, supplies the Premier League’s official statistics, while Hudl’s tools are widely used by clubs for video and performance analysis.
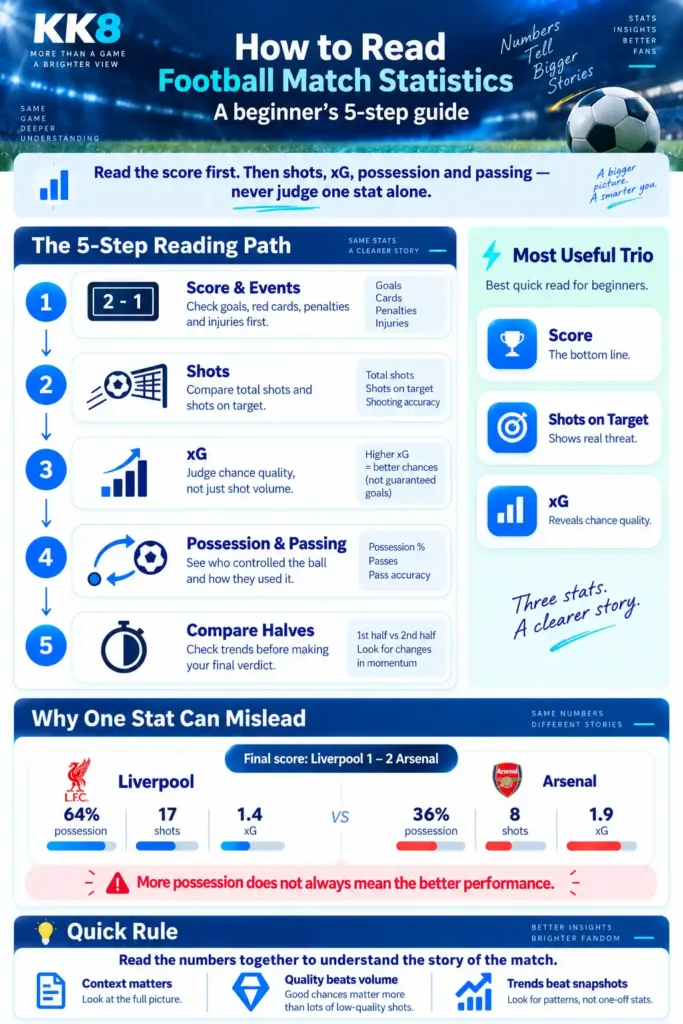
How to Read Football Match Statistics in 5 Steps
Read a stats screen in this order. Each step adds context to the one before it, so you don’t jump to conclusions from a single eye-catching number.
- Check the score and major match events. Note the goals, red cards, penalties and injuries, and when they happened. A red card in the 20th minute changes every number that follows, and a team that goes 2-0 up early will often let the opponent have the ball.
- Compare total shots and shots on target. Total shots show attacking intent. Shots on target show how many attempts actually tested the goalkeeper. A big gap between the two, such as 18 shots with only 3 on target, often points to rushed or long-range efforts.
- Review xG to judge chance quality. xG estimates how many goals a team’s chances would usually produce. Compare it with actual goals: a team scoring 3 from 1.2 xG finished unusually well, while a team scoring 0 from 2.5 xG wasted good chances or met an inspired goalkeeper.
- Check possession, passing and defensive activity. Now look at who had the ball and what they did with it. High possession with low xG often means a team passed around the opponent without breaking through. Low possession with plenty of tackles and interceptions may be a deliberate plan to defend deep and counter-attack.
- Compare both halves before drawing a conclusion. Most stats sites let you filter by half or view a match timeline. A team that dominated the first half may have been outplayed after the break, and full-match totals hide that.
Finish with one question: does the story told by shots and xG match the score? If it does, the result probably reflects the balance of play. If it doesn’t, find the reason (finishing, goalkeeping, a red card, a penalty) before you decide who “deserved” to win.
Key Football Match Statistics Explained
Each statistic below follows the same pattern: what it measures, an example, how to read it, and where it falls short.
Ball Possession
What it measures: the share of the match each team had the ball, shown as a percentage that adds up to 100%. Providers calculate it differently. Many, including Opta, base it on each team’s share of passes rather than a stopwatch.
Example: Team A has 70% possession, Team B has 30%.
How to read it: possession tells you about style and control. A 70% team usually spent long spells passing in the opponent’s half.
Limitation: possession doesn’t measure danger. Teams that are leading often hand the ball over on purpose, and some sides are built to win without it. Leicester City won the 2015-16 Premier League title while regularly having less of the ball than their opponents.
Total Shots vs Shots on Target
What it measures: a shot is any deliberate attempt to score, whether it’s on target, off target or blocked. A shot on target is one that would have gone in without a save by the goalkeeper or a last-ditch block. Goals count as shots on target.
Example: Team A has 20 shots with 4 on target. Team B has 7 shots with 5 on target.
How to read it: Team A was busier, but Team B was more accurate and probably worked its way into better positions.
Limitation: a tap-in from two yards and a hopeful strike from 35 yards each count as one shot. To judge quality, you need xG.
Expected Goals (xG)

What it measures: the probability that a shot becomes a goal, from 0 to 1, based on how often similar shots have been scored in the past. Models consider factors such as distance, angle, body part (foot or head) and the type of chance, such as a cross, through ball or set piece. A team’s xG is the sum of all its shots.
Example: a shot from 30 yards might be worth 0.03 xG. A one-on-one from 10 yards might be worth 0.40. A penalty is usually valued at around 0.75 to 0.8, depending on the model.
How to read it: if Team A ends with 2.1 xG and Team B with 0.6, Team A created far better chances, whatever the score. Want the full picture? Read our guide on what xG means in football.
Limitation: xG is a probability, not a prediction. Over one match, finishing skill, goalkeeping and luck can easily outweigh it, and different providers’ models produce different figures. Some sites also show xGOT (expected goals on target), which rates on-target shots by where they were placed, a useful guide to how hard a goalkeeper was tested.
Passing Accuracy
What it measures: completed passes as a percentage of attempted passes.
Example: Team A completes 92% of 600 passes. Team B completes 78% of 350 passes.
How to read it: Team A kept the ball securely. Team B may have played more direct, riskier passes forward.
Limitation: passing accuracy ignores difficulty and direction. Ten sideways passes between centre-backs count the same as ten defence-splitting through balls. Analysts use metrics such as progressive passes (passes that move the ball significantly towards goal) to fill that gap.
Corners, Fouls and Cards
What they measure: corners are awarded when the defending team last touches the ball before it crosses its own goal line. Fouls and cards record rule breaks and the referee’s response.
Example: Team A wins 11 corners to Team B’s 2. Team B commits 15 fouls and receives 4 yellow cards.
How to read it: lots of corners usually reflect sustained pressure near goal. A high foul count can mean a team was under pressure, or that it was deliberately breaking up attacks.
Limitation: most corners don’t lead to a goal, so a corner count alone says little about dominance. Fouls and cards also depend heavily on the referee and the competition. The exception is a red card, which reshapes the rest of the match and should always be read alongside the timeline.
Which Football Statistics Matter Most?
No statistic matters most on its own, but some give you more useful context than others. Shots on target and xG usually tell you more about who created danger than possession does, because they measure chances rather than control.
| Statistic | Most useful for | Where it falls short |
| Score and match events | Context for every other number | Says nothing about how the result happened |
| Shots on target and xG | How many good chances each team created | xG is an estimate, and one match is a small sample |
| Total shots | Attacking volume and intent | Treats every attempt as equal |
| Possession and passing | Playing style and control | Doesn’t measure threat |
| Corners | Pressure in the final third | Few corners become goals |
| Fouls and cards | Discipline and game state | Strongly influenced by the referee |
The real value comes from combinations. High possession with high xG suggests control that turned into danger. High possession with low xG suggests a team that passed a lot but rarely broke through. Low possession with high xG often points to effective counter-attacks.
Football Match Statistics Example: Reading a Complete Match
The match and all figures below are fictional, created to show the method.
Statistic | Liverpool | Arsenal |
Final score | 1 | 2 |
Possession | 64% | 36% |
Total shots | 17 | 8 |
Shots on target | 5 | 4 |
Expected goals (xG) | 1.4 | 1.9 |
Passing accuracy | 88% | 79% |
Corners | 9 | 3 |
Fouls | 9 | 13 |
Yellow cards | 1 | 3 |
Goals: Arsenal 23′ (counter-attack, one-on-one), Liverpool 51′, Arsenal 74′ (penalty). No red cards.
Here’s how the five steps apply:
- Score and events: Arsenal won 2-1 and led for most of the match, so Liverpool spent long spells chasing the game.
- Shots: Liverpool had more than twice as many shots (17 to 8), but only 5 were on target (29%). Arsenal put 4 of 8 on target (50%).
- xG: Arsenal created more expected goals (1.9 to 1.4). The penalty accounts for roughly 0.8 of that, but even without it Arsenal’s chances averaged about 0.16 xG per shot, double Liverpool’s 0.08.
- Possession and defending: Liverpool’s 64% possession, 88% passing accuracy and 9 corners show control and territory. Arsenal’s 13 fouls and 3 yellow cards suggest a team defending deep and breaking up attacks.
- Halves: Liverpool’s shot count rose sharply after falling behind (see the live statistics below), which is typical of a team chasing a result.
The verdict: Liverpool controlled the ball. Arsenal created the better chances and took them. The result fits the xG, but the gap (0.5) is small enough that a draw wouldn’t have been surprising. These numbers describe a past match. They don’t predict the next one.
Want to take this further? Learn how to analyse a football match, where team form and match context sit alongside the statistics.
How to Read Live Football Match Statistics
Live statistics are cumulative, so they build up through the match and change meaning as the score changes. A team that goes ahead often sits back, and the team behind takes more risks. That shifts possession, shots and fouls in ways that full-time totals hide.
Here’s the same fictional match at three checkpoints:
| Minute | Score (LIV-ARS) | Possession | Total shots | Shots on target |
| 30′ | 0-1 | 58%-42% | 4-4 | 1-2 |
| 60′ | 1-1 | 63%-37% | 10-5 | 3-2 |
| 90′ | 1-2 | 64%-36% | 17-8 | 5-4 |
After Arsenal scored, Liverpool’s possession and shot count climbed. Between 30 and 60 minutes, Liverpool took six more shots, but the xG timeline below shows those shots added only about 0.6 xG, a sign of many low-quality attempts.
Arsenal’s line jumps twice, at their 23rd-minute chance and the 74th-minute penalty, while Liverpool’s climbs slowly through many smaller chances.
When you follow a live match, watch the trend in shots on target and xG rather than possession, which swings a lot in the opening minutes. And always check for red cards: from that moment on, the earlier numbers describe a different match.
Common Mistakes When Reading Football Statistics
- Assuming more possession means a better performance. Possession measures control, not danger. Always check what a team did with the ball.
- Treating shot count as chance quality. Twenty long-range shots can be worth less than three close-range chances. Look at shots on target and xG together.
- Judging a team on one match. A single game is a small sample. Finishing streaks, goalkeeping and refereeing decisions even out over a season, so look at several matches before judging form.
- Comparing figures from different providers. Possession, xG and even “shots on target” can be defined slightly differently from one site to the next. Compare numbers from the same source.
Where to Find Reliable Football Match Statistics
- Premier League: the official Premier League stats pages use Opta data and explain how each statistic is defined.
- Opta Analyst: theanalyst.com publishes stats definitions, xG explainers and match data across major leagues.
- Singapore Premier League: the official SPL website carries club and player statistics, useful if you follow Lion City Sailors or other local clubs.
When you check any source, look for a stated data provider, a definitions page and consistent figures across matches. Be cautious with social media screenshots and unofficial sites that don’t say where their numbers come from.
Explore more beginner-friendly football guides, or read Over/Under explained to see how markets based on total goals work and how they are settled.
Frequently Asked Questions
What are the most important football match statistics?
For beginners, the score, shots on target and xG are the most informative trio. Together they show who created the better chances and whether those chances were taken. Possession and passing then explain how each team played.
What is the difference between shots and shots on target?
Shots include every deliberate attempt to score, including blocked and missed efforts. Shots on target only count attempts that would have gone in without a save or a last-ditch block.
Does higher possession mean a team played better?
Not always. Possession shows who had the ball, not who created danger. Teams that are leading, or that play on the counter-attack, often win with less of the ball.
How do you know which football team performed better?
Compare the quality of chances each team created (shots on target and xG) with the final score, then check the match events and both halves. If the numbers and the score point the same way, the result likely reflected the balance of play.
Are football match statistics accurate?
Event data from major providers is collected carefully and is generally reliable for counts such as shots, passes and corners. Some categories involve judgement, though, and model-based figures such as xG vary between providers, so small differences between sites are normal.