Skip to content


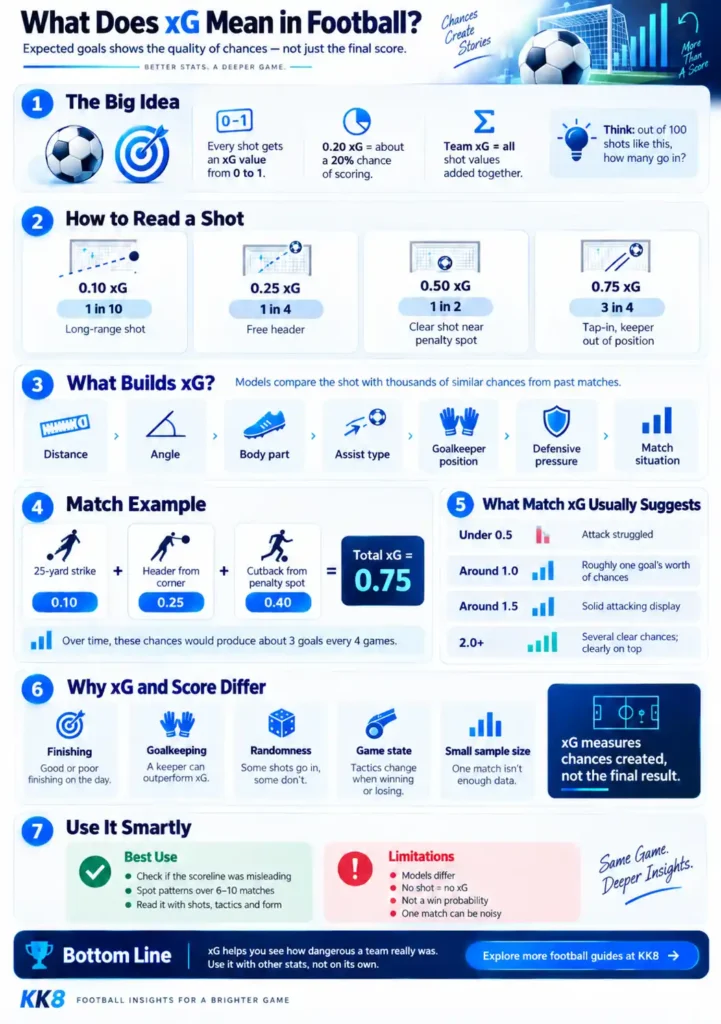
xG stands for expected goals. It is a football statistic that measures how likely a shot is to become a goal, based on thousands of similar shots taken in the past. A shot worth 0.20 xG, for example, has roughly a 20% chance of being scored.
You’ll now see xG on Premier League broadcasts, post-match graphics and most stats apps, usually right next to the score. This guide explains the xG meaning in football in plain terms: how the number is built, how to read it after a match, and where it stops being useful.
What Does xG Mean in Football?
Every shot gets an xG value between 0 and 1. Zero is a chance that is almost impossible to score; one is a chance an average player would score every time. Most shots sit much closer to zero, because most shots in football miss.
The easiest way to read the number is: “out of 100 shots like this, how many went in?”
| Shot xG | Chance of scoring | Roughly | Typical situation (illustrative) |
| 0.10 | 10% | 1 in 10 | Shot from the edge of the box with defenders in the way |
| 0.25 | 25% | 1 in 4 | Free header from around eight yards |
| 0.50 | 50% | 1 in 2 | Shot from near the penalty spot with a clear view of goal |
| 0.75 | 75% | 3 in 4 | Tap-in with the goalkeeper out of position |
A team’s xG is simply all its shots added together. That’s why a team can finish a match on 2.4 xG even though no single shot can be worth more than 1.0. Think of the total as the number of goals an average side would score from those exact chances, on average, if the match could be replayed many times.
How Is xG Calculated in Football?
Data providers build xG models from historical shots. Opta’s model, for example, is trained on nearly one million shots. For every new shot, the model asks how often similar shots in the past became goals, and turns that into a probability.
The factors that usually matter most:
- Distance: the closer the shot, the more often it goes in.
- Angle: a shot from straight in front of goal beats one from the same distance at a tight angle.
- Body part: from the same spot, a shot with the foot is more likely to score than a header.
- Type of assist: chances from crosses are generally harder to convert than through balls or cutbacks.
- Goalkeeper position: a keeper caught out of position pushes the value up sharply.
- Defensive pressure: defenders blocking the goal or closing down the shooter push it down.
- Situation: open play, counter-attack, corner or direct free kick.
Not every model uses all of these. Basic models lean on distance, angle, body part and assist type. More detailed ones, such as Opta’s and Hudl StatsBomb’s, also account for where the goalkeeper and defenders were standing. Penalties get a fixed value based on how often they are historically scored: 0.79 xG in Opta’s model and 0.78 in StatsBomb’s.
A worked example
Say a team takes three shots in a match:
| Shot | Situation | xG |
| 1 | Low strike from 25 yards through a crowded box | 0.10 |
| 2 | Header from a corner, six yards out, under pressure | 0.25 |
| 3 | Cutback finished from the penalty spot, keeper set | 0.40 |
| Total | 0.75 |
The team created chances worth 0.75 expected goals. Nobody can score three-quarters of a goal, so read it as a long-run average: given this exact set of chances in many matches, an average team would score about three goals every four games.

What Does 1.0, 1.5 or 2.0 xG Mean?
A team’s match xG is a rough measure of how much its attack deserved to produce. As a loose guide for a single Premier League match:
| Match xG | What it usually suggests |
| Under 0.5 | Very few good chances; the attack struggled |
| Around 1.0 | Enough quality for roughly one goal on an average day |
| Around 1.5 | A solid attacking display |
| 2.0 or more | Several clear chances; the attack was clearly on top |
Two things to keep in mind. First, 2.0 xG does not mean a team should have scored exactly two. How the total is built matters. Picture two teams that both finish on 1.0 xG:
- Team A had ten shots worth 0.10 each.
- Team B had one big chance worth 0.90 and one shot worth 0.10.
Team A fails to score in about 35% of matches like that, while Team B draws a blank only about 9% of the time. Same xG, very different matches.
Second, xG is not a win probability. A 2.0 to 1.0 xG match doesn’t mean the first team had a two-in-three chance of winning. Turning xG into win chances needs a separate simulation, which is how expected points (xPts) tables are built.

Why Can a Team With Higher xG Still Lose?
Because xG measures the chances, not the result. Take this fictional match:
| Team | xG | Goals |
| Arsenal | 2.3 | 1 |
| Liverpool | 0.8 | 2 |
Arsenal created far better chances, yet Liverpool won. Results like this happen most weekends, for a handful of reasons:
- Finishing: xG assumes an average finish. A striker who drags a 0.40 chance wide, or one who curls a 0.05 shot into the top corner, moves the result away from the xG.
- Goalkeeping: xG is calculated before the shot is struck, so it gives no credit for a great save.
- Randomness: deflections, the woodwork and scrambles in the box all swing low-scoring games.
- Game state: once Liverpool led, they may have sat deeper and let Arsenal shoot. A trailing team often piles up xG late on that says more about the scoreline than its quality.
- Small samples: a typical match has only around 25 shots in total, and just a few of them really matter.
So was Arsenal the “deserved” winner? Not automatically. xG tells you Arsenal created more and better chances. It doesn’t tell you how the early goals shaped the rest of the match, or how good Liverpool’s finishes were.
xG vs Shots on Target: What's the Difference?
Shots on target count attempts that score or would have scored without a save. They tell you how often a team tested the goalkeeper, but not how good the chances were. A tame 30-yard effort straight at the keeper counts the same as a header from two yards.
| Stat | What it measures | What it misses |
| Shots | Every attempt at goal | Quality of each attempt |
| Shots on target | Attempts that scored or forced a save | How dangerous the chance was |
| xG | Quality of chances, before the shot is struck | How well the shot was actually hit |
| Goals | The final outcome | Luck, saves and missed chances |
Here’s why it matters. Team A has 15 shots, 6 on target and 0.9 xG, mostly from long range. Team B has 7 shots, 3 on target and 2.1 xG, mostly from inside the six-yard box. On shot counts Team A looks better; on chance quality, Team B was far more dangerous.
xG is only one part of understanding a match. Our guide tofootball match statistics explains how to read shots, possession and other performance numbers together.
Real Premier League Examples of xG
These five matches from the 2025-26 Premier League, all measured with the same Opta model, show how far a single game can drift from its xG.
At the top, teams scored far more than their chances suggested. Nottingham Forest’s 5-0 win at Sunderland came from barely one goal’s worth of chances. At the bottom, Liverpool against Burnley and Chelsea at Tottenham created more than three goals’ worth of chances each and scored once.
None of this proves Forest have elite finishers or that Chelsea’s are poor. One match is far too small a sample to separate skill from luck, a great save or a deflection. What it does show is that the scoreline and the chances can tell very different stories, which is exactly why xG is worth a look after any game.
How Useful Is xG When Analysing a Football Match?
xG is most useful as a check on the scoreline. It helps you answer questions a result alone can’t:
- Chance creation: did a team win because it carved out good chances, or because it scored from almost nothing?
- Patterns over time: a side that keeps creating 1.8 xG a game but scoring once is likely underperforming in front of goal; one scoring twice a game from 0.9 xG is probably riding good fortune.
- Defence: xG conceded shows whether a tight defensive record is built on stopping chances or on a goalkeeper having a great run.
It works best over several matches. Averages across the last six to ten games smooth out the noise of single results far better than one 90 minutes can.
Still, treat xG as one input, not the answer. Read it next to injuries, fixtures, tactics and the other match numbers. And remember that a team’s past xG describes chances already created; it doesn’t predict the outcome of the next match on its own.
Readers interested in studying team performance more closely can learn how to analyse a football match using recent form, match statistics and other factors.
xG measures the quality of chances already created, while over/under betting concerns whether the total number of goals finishes above or below a set line. Our guide, over/under betting explained, covers how it works.
What Are the Limitations of xG?
xG is a strong tool, but it has blind spots worth knowing:
- Models disagree. Providers use different inputs. StatsBomb gives an example of the same shot being worth 0.30 xG in a basic model and 0.65 in one that knows the goalkeeper was out of position.
- Small samples mislead. One match, or even a month, carries a lot of noise. The picture gets more reliable over a season.
- No shot, no xG. A dangerous cross that flashes across the six-yard box with nobody touching it adds nothing, even though it was a big moment.
- Finishing skill is real, but rare. A few elite finishers beat their xG season after season. Most players finish close to average over time, so short hot streaks usually fade.
- It isn’t a result forecast. Higher xG suggests better chances, not a guaranteed or even likely win in any given match.
One common misconception: a player who has scored fewer goals than their xG is not “due” a goal next match. As Opta points out, that is the gambler’s fallacy. Each new shot is a fresh chance; past misses don’t make the next one more likely to go in.
Other Football Statistics Related to xG
Once you understand xG, a few related metrics become easy to follow:
| Metric | Stands for | What it tells you |
| xGA | Expected goals against | The quality of chances a team allows its opponents |
| xA | Expected assists | The xG value of shots that come from a player’s passes |
| xGOT | Expected goals on target | Chance quality after the shot, accounting for where it was placed; off-target shots score zero |
| npxG | Non-penalty xG | xG with penalties removed, a fairer view of open-play and set-piece threat |
xGOT is the useful one for judging finishing and goalkeeping: if a striker’s xGOT is well above their xG, they are hitting their shots better than the average player would.
The Bottom Line
xG tells you how good a team’s chances were, not how many goals it was guaranteed to score. Read it over several matches, alongside other statistics, and it becomes one of the clearest ways to see past a misleading scoreline.
Sources
- Opta Analyst: What Is Expected Goals (xG)? (model inputs, penalty value, misconceptions)
- Hudl StatsBomb: What are Expected Goals (xG)? (model differences, penalty value, finishing skill)
- Squawka: Premier League table 2025-26 based on xG (match xG, Opta data)
Frequently Asked Questions
Is higher xG always better?
Usually, yes: it means a team created more valuable chances. But it doesn’t guarantee a win. Finishing, goalkeeping, game state and luck all decide individual matches.
What is a good xG in football?
There’s no universal figure, because it depends on the league and the opponent. As a rough guide, around 1.5 xG or more in a Premier League match is a strong attacking performance, and above 2.0 is a dominant one.
Can a team score more goals than its xG?
Yes, and it happens often. Clinical finishing, a few long-range strikes or a struggling goalkeeper can push goals well above xG in a single match or a short run.
Does a penalty count towards xG?
Yes. Most models give a penalty a fixed value based on historical conversion rates: about 0.79 xG in Opta’s model. That’s why analysts often look at non-penalty xG (npxG) as well.
Why is xG different across football websites?
Each data provider uses its own model and inputs. Some track goalkeeper and defender positions, others don’t, so the same shot can carry different values. Compare figures from one provider only.